
Example: plotting voltage profile#
from opendssdirect import dss
dss('Redirect "../../tests/data/13Bus/IEEE13Nodeckt.dss"')
Various of OpenDSS functions require a meter, so we add one:
dss("New EnergyMeter.Main Line.650632 1")
import networkx as nx
import matplotlib.pyplot as plt
dss.Solution.Solve()
df = dss.utils.lines_to_dataframe()

def create_graph(phase=1):
    G = nx.Graph()

    data = df[['Bus1', 'Bus2']].to_dict(orient="index")

    for name in data:
        line = data[name]
        if f".{phase}" in line["Bus1"] and f".{phase}" in line["Bus2"]:
            G.add_edge(line["Bus1"].split(".")[0], line["Bus2"].split(".")[0])

    pos = {}
    for name in dss.Circuit.AllBusNames():
        dss.Circuit.SetActiveBus(f"{name}")
        if phase in dss.Bus.Nodes():
            index = dss.Bus.Nodes().index(phase)
            re, im = dss.Bus.PuVoltage()[index:index+2]
            V = abs(complex(re, im))
            D = dss.Bus.Distance()

            pos[dss.Bus.Name()] = (D, V)

    return G, pos
fig, axs = plt.subplots(1, 1, figsize=(16, 10))
ax = axs
G, pos = create_graph(phase=1)
nx.draw_networkx_nodes(G, pos, ax=ax)
nx.draw_networkx_labels(G, pos, ax=ax, labels={x: x for x in G.nodes()})
nx.draw_networkx_edges(G, pos, ax=ax)
ax.grid()
ax.set_ylabel("Voltage in p.u.")
ax.set_xlabel("Distances in km")
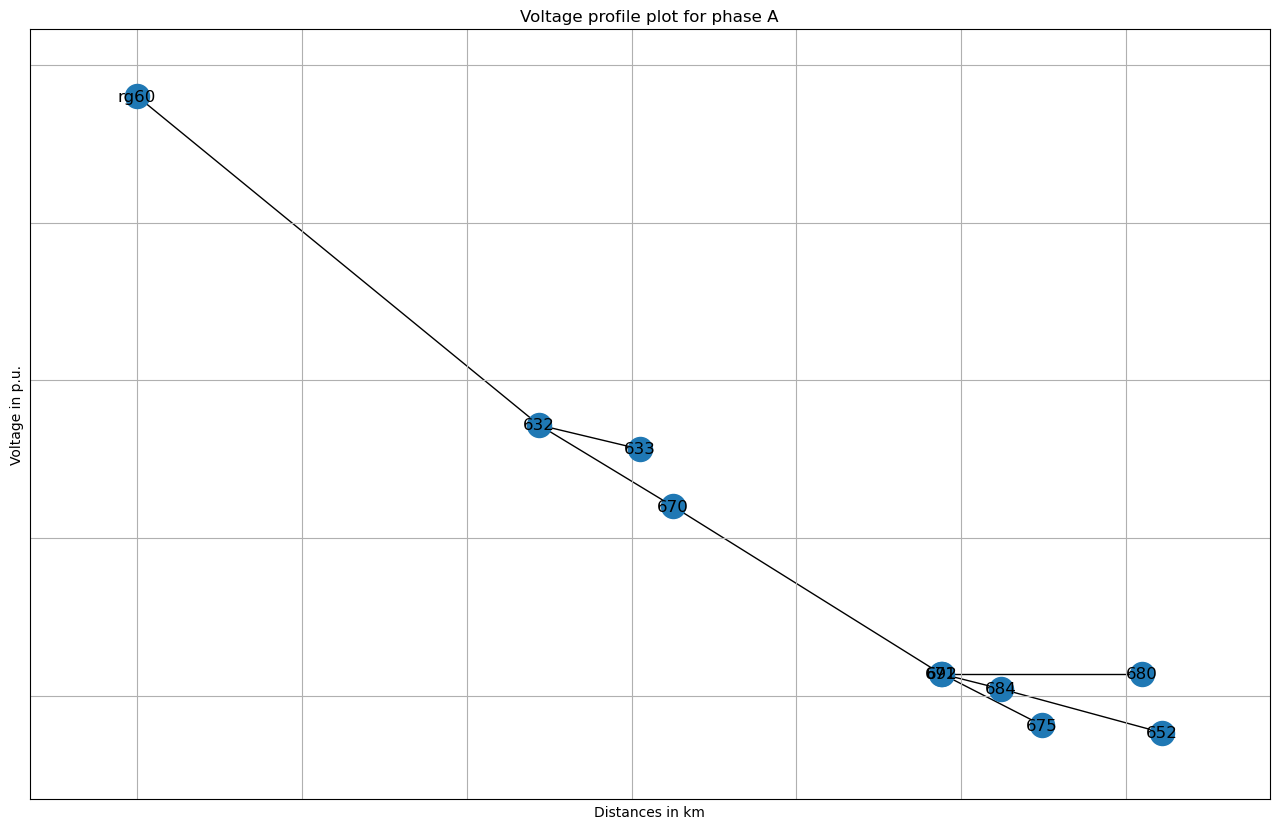
ax.set_title("Voltage profile plot for phase A");
Integrated plotting#
DSS-Extensions also provide replacements for directly plotting from the DSS engine, using matplotlib. This component is completely shared with DSS-Python. It can be enabled like follows:
from dss import plot
plot.enable()
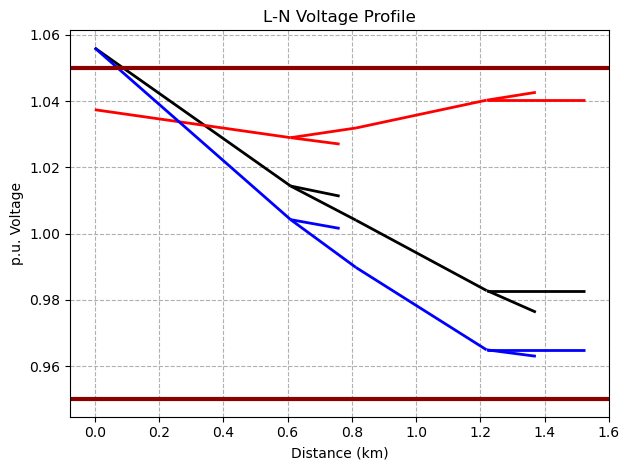
dss('plot profile')
When you enable plotting, currently the notebook integration is also enabled if you are running through a notebook. With that, you can add %%dss cells to run DSS script snippets:
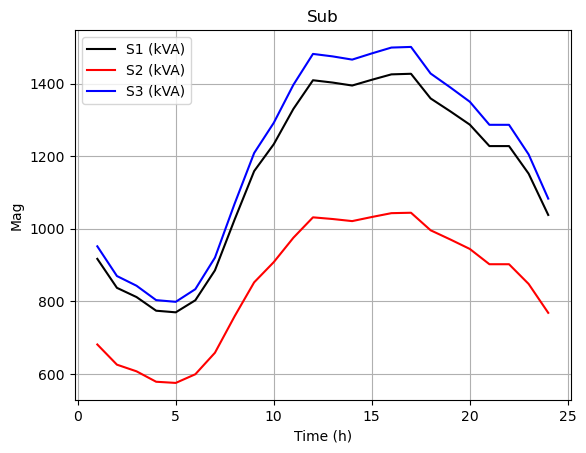
%%dss

BatchEdit Load..* daily=default
New Monitor.Sub Element=Transformer.sub Terminal=2 Mode=1
Solve Mode=Daily
Plot Monitor Object=Sub
See also Plotting and notebook integration for an extensive example gallery.